11.27.2013

Analyzing Regression Models

Regression models are formally introduced in Algebra 1; however, the standards for require that students analyze further to compute, with technology, and interpret the correlation coefficient of a linear fit (HSS-ID.C.8) and informally assess the fit of a function by plotting and analyzing residuals (HSS-ID.B.6b).

Students can use residuals, specifically a residual plot, to assess the appropriateness of the selected regression model. The difference between the observed function value (data) and the predicted function value (regression equation) is a residual. Each data point has one residual. A residual plot is a graph that shows the residuals on the vertical axis with respect to the independent variable on the x-axis.
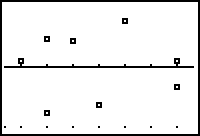
Residual Plot
If the points in a residual plot are randomly dispersed around the horizontal axis, then the selected regression model is appropriate. If a pattern appears, the selected regression model is not a good fit. When using the TI-84 graphing calculator to create a residual plot, turn off the Y1= that will hold the regression equation. In your STAT 1:EDIT menu, cursor to the top of the column for L3 and select 2nd STAT for LIST to select RESID. Press ENTER and the residuals for each data point will be listed in L3. Select 2nd Y= for STAT PLOT and change the YList to L3. Select ZOOM 9:ZoomStat to view the residual plot.

The correlation coefficient (and the coefficient of determination) will be computed on the TI-84 graphing calculator when a regression equation is calculated.

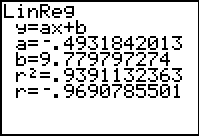
Note: If you only see the regression equation details, go to MODE and select ON for Stat Diagnostics.
A correlation coefficient (r) measures the strength and direction of the association. In other words, the correlation coefficient reveals how well the selected function type fits the data. The closer the absolute value of r is to 1, the stronger the association. For example, r=0.75 would be considered moderately strong while r=0.50 would be considered weak. A correlation of 0 indicates there is no relationship between the variables. Note: If there is no correlation between the data sets, we cannot classify as a strong or weak association. To interpolate means to make a prediction with the data set. To extrapolate means to make a prediction beyond the data set. The coefficient of determination (r^2) reveals the accuracy of a prediction based on the regression equation. The prediction is more accurate the closer r^2 is to 1.

These TI-84 calculator hints support Common Core State Standards HSS-ID.B.6b and HSS-ID.C.8 included in 7th and 8th Accelerated Algebra 1.

Correlation vs. Causation

While investigating bivariate data and analyzing regression models by using the correlation coefficient to determine the function's fit to the data, the Common Core State Standards require Algebra 1 students to distinguish between correlation and causation. I posted the following infographic on our class website for student review.

Correlation vs. Causation (A Mathographic)
Created by SEOmoz (Copyright ©2011).

Students generally struggle with correlation not implying causation. The following examples help to clarify that the presence of both correlation and causation can occur, but the connection cannot be assumed.


Students use the RallyRobin stucture for Kagan cooperative learning to review correlation and causation before we summarize their learning in a whole class discussion.

This discussion activity highlights Common Core State Standard HSS-ID.C.9 included in 7th and 8th Accelerated Algebra 1.

10.31.2013

Regression Models

The Common Core State Standard for investigating patterns of association in bivariate data begins in MATH-8 and is further expanded in Algebra 1. However, these standards are merged in Acclerated Algebra 1.

The Tongue Twister Lab Activity prompts students to gather data, analyze visually, and use an informal model to make a prediction. (CCSS 8.SP.A.2) This activity not only gives students a context as a foundation, but it also compartmentalizes the process used with regression via technology. Each student is provided a list of Halloween tongue twisters to review, select, and present to his team. Then the team selects one twister to use for data collection. This activity is intended to be completed manually...think large graph paper, meter sticks, etc.

Tongue Twister Lab Activity

Teachers can integrate a class discussion to review proportional vs. non-proportional relationships, linear vs. nonlinear, comparing rate of change between trend lines from different teams, etc. And then it's time to formally fit a function to the data with the use of technology. The duration of this lesson generally spans two 80-minute periods.

It may be helpful to provide students with a Regression Guide to follow when completing the steps in a graphing calculator. Don't be discouraged if it takes several attempts for students to become fluent with the graphing calculator. Additional problems can provide formative assessment on their progress with technology and an opportunity to interpret the rate of change and initial value within new contexts of data.

Cell Phone Problem

And this Election Day problem is time-sensitive; however, the idea can be adjusted to any election being conducted in your area.

The following activity is most conducive to cooperative learning teams. Students are provided details about three players gathering gold coins in a marathon month of the Super Mario game. The scenarios yield linear, exponential, and quadratic function models. Not only does this activity prompt students to investigate patterns and utilize regression via technology, but it also overviews the three major functions included in Algebra 1.

Team Problem

Super Mario Functions Record Sheet

This activity set highlights Common Core State Standards 8.SP.A.2, HSS-ID.B.6a, HSS-ID.B.6c, and HSS-ID.C.7 included in 7th and 8th Accelerated Algebra 1.

10.25.2013

Characteristics of Functions

The Common Core State Standards include three functions in Algebra 1.
  • linear
  • exponential
  • quadratic

Linear and quadratic functions are exhausted. Exponential functions are introduced with respect to making comparisons between arithmetic and geometric sequences but not exhausted. Absolute value functions are optional for Algebra 1; however, the spin-off from linear functions is seamless. And absolute value functions are perfect for initial practice with function transformations.

Several linear function concepts are introduced in MATH-8, but these are the same standards that are pushed to Accelerated Algebra 1 in the CCSS Accelerated Pathway outlined in Appendix A. The Retro Race activity contains a problem set that can be integrated throughout a linear functions unit or used as a cumulative review at the conclusion of the unit. (This activity stems from CPM Sample Chapters and LTF Training.)


A portion of the problem set highlights one of the participants in the race. Based on the information provided, students are prompted to create a table of values to view the participant's distance as a function of time and subsequently graph the results.

Characteristics of Functions Record Sheet

Students use the context of the situation to understand key features of the function including intercepts and intervals where the function is increasing, decreasing, positive, or negative.

This investigation highlights Common Core State Standard HSF-IF.B.4 that is included in 7th and 8th Accelerated Algebra 1.

8.14.2013

Frayer Model Sample

The Frayer Model was developed by Dorothy Frayer and her colleagues at the University of Wisconsin. This graphic organizer will lead students to a thorough understanding of new words. The corners generally include definition, facts or characteristics, examples and non-examples.

This is the modified template used in my math classroom. Based on the content, the example corner may include non-examples as well.


In order for students to communicate mathematically, they need a deep understanding of the content. Summarizing critical vocabulary via the Frayer Model can jumpstart this process.


This vocabulary graphic organizer highlights the Common Core State Standard HSF-IF.B.4 that is included in 7th and 8th Grade Accelerated Algebra 1.

7.24.2013

Coming soon...


UNDER CONSTRUCTION

This page will host content specific to the Algebra 1 standards.