Regression models are formally introduced in Algebra 1; however, the standards for require that students analyze further to compute, with technology, and interpret the correlation coefficient of a linear fit (HSS-ID.C.8) and informally assess the fit of a function by plotting and analyzing residuals (HSS-ID.B.6b).
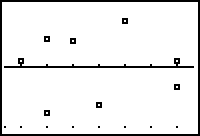
Students can use residuals, specifically a residual plot, to assess the appropriateness of the selected regression model. The difference between the observed function value (data) and the predicted function value (regression equation) is a residual. Each data point has one residual. A residual plot is a graph that shows the residuals on the vertical axis with respect to the independent variable on the x-axis.
 |
| Residual Plot |
If the points in a residual plot are randomly dispersed around the horizontal axis, then the selected regression model is appropriate. If a pattern appears, the selected regression model is not a good fit. When using the TI-84 graphing calculator to create a residual plot, turn off the Y1= that will hold the regression equation. In your STAT 1:EDIT menu, cursor to the top of the column for L3 and select 2nd STAT for LIST to select RESID. Press ENTER and the residuals for each data point will be listed in L3. Select 2nd Y= for STAT PLOT and change the YList to L3. Select ZOOM 9:ZoomStat to view the residual plot.
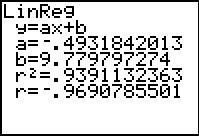
The correlation coefficient (and the coefficient of determination) will be computed on the TI-84 graphing calculator when a regression equation is calculated.
 |
| Note: If you only see the regression equation details, go to MODE and select ON for Stat Diagnostics. |
A correlation coefficient (r) measures the strength and direction of the association. In other words, the correlation coefficient reveals how well the selected function type fits the data. The closer the absolute value of r is to 1, the stronger the association. For example, r=0.75 would be considered moderately strong while r=0.50 would be considered weak. A correlation of 0 indicates there is no relationship between the variables. Note: If there is no correlation between the data sets, we cannot classify as a strong or weak association. To interpolate means to make a prediction with the data set. To extrapolate means to make a prediction beyond the data set. The coefficient of determination (r^2) reveals the accuracy of a prediction based on the regression equation. The prediction is more accurate the closer r^2 is to 1.
These TI-84 calculator hints support Common Core State Standards HSS-ID.B.6b and HSS-ID.C.8 included in 7th and 8th Accelerated Algebra 1.


